
In the fast-paced world of construction, where projects are complex, deadlines are tight, and budgets are strict, the ability to monitor and control progress is fundamental. Effective management not only means planning — it also means supervising continuously to ensure the project stays on track. In this context, the S-Curve emerges as an indispensable visual tool, giving project managers a clear and concise picture of project status, facilitating informed decision-making, and ultimately ensuring success.
What is the S-Curve and why is its shape so relevant?
The S-Curve is a cumulative graphical representation of a project's data over time. Its name comes from its characteristic shape, which resembles the letter "S," reflecting the typical lifecycle of most projects.
This "S" shape is not random; it is a direct reflection of:
- Slow start: At the beginning, cumulative progress is gradual due to planning, mobilization, and preparation activities. This initial investment flow is low (Mattos and Valderrama, 2014).
- Acceleration: Once the project is underway, activity intensifies, resulting in a sharp, rapid rise in the curve. This is the phase of greatest execution, where investment increases as tasks advance (Denis F. Cioffi, 2005).
- Plateau or completion: As the project nears its end, the pace of work tends to slow down, since the remaining tasks are usually smaller in scope or relate to closeout activities, flattening the curve as investment decreases (Denis F. Cioffi, 2005).
The S-Curve for a project is a result of the schedule produced during planning and can be applied to the consumption of any resource, since it represents either physical or monetary progress (Mattos and Valderrama, 2014). Denis F. Cioffi (2005) notes that this shape is common in project management and presents an equation that managers can use to generate any desired smooth profile by selecting the strength of the curve's ascent and the point at which half of the total resources (e.g., costs) have been spent across project phases:
The S-Curve can represent various key metrics for project tracking, such as:
- Cumulative cost: Total sum of expenses incurred up to a given point in time.
- Cumulative hours worked: Total labor hours used.
- Earned Value (EV): The budgeted value of work actually completed.
- Percentage of progress: The percentage of project completion.
Key benefits of the S-Curve in construction project management
Implementing the S-Curve offers multiple advantages for construction project managers:
- Clear, real-time visibility: Provides an instant, easy-to-understand snapshot of project progress compared to the original plan, allowing quick identification of whether the project is ahead, behind, or on track.
- Early detection of deviations: By comparing the planned curve to the actual one, it is possible to detect deviations (delays or cost overruns) in their early stages, which is crucial for mitigating their impact.
- Facilitates effective communication: It is a powerful visual tool that simplifies communicating project status to all stakeholders (clients, investors, work teams), improving transparency and confidence.
- Performance analysis and outcome prediction: Enables trend analysis, evaluation of project performance to date, and — based on that data — prediction of possible completion dates and total costs, facilitating proactive decision-making.
Types of S-Curves and their practical application
For comprehensive management, different types of S-Curves are used:
- Planned S-Curve (Baseline): Represents the approved schedule and budget for the project. This is the reference against which actual progress will be measured.
- Actual S-Curve: Shows the real progress of the project in terms of cost, hours, or earned value to date.
- Earned Value S-Curve: A fundamental component of Earned Value Management (EVM). It compares the Planned S-Curve, the Actual S-Curve (real cost), and the Earned Value S-Curve to provide a complete picture of project performance in terms of cost and schedule.
A simple practical example applied to the construction of a building:
Imagine building a 10-story building. The Planned S-Curve shows how costs or percentage progress are expected to accumulate month by month.
- If the Actual S-Curve is below the planned curve, the project is behind schedule or under budget (if the metric is cost).
- If the Actual S-Curve is above the planned curve, the project is ahead of schedule or over budget.
- If the Earned Value S-Curve is below the planned curve, it means that the completed work is worth less than what was budgeted for that point, indicating a schedule delay.
If the actual cost is above the earned value, the project is experiencing a cost overrun.
How to create and use an S-Curve step by step
Creating and effectively using an S-Curve involves a series of structured steps:
- Define the metric to monitor: Decide which aspect of the project you want to track (cost, hours, physical progress, etc.) based on the main objectives.
- Establish the baseline plan: Develop a detailed schedule and budget for the entire project. Break the work down into manageable packages and assign resources and costs to each. This will form your Planned S-Curve.
- Collect and update real data: During project execution, regularly collect actual progress data (costs incurred, hours worked, physical progress).
- Plot the S-Curve: Use appropriate tools to plot both the planned and actual curves on the same time axis.
Example:
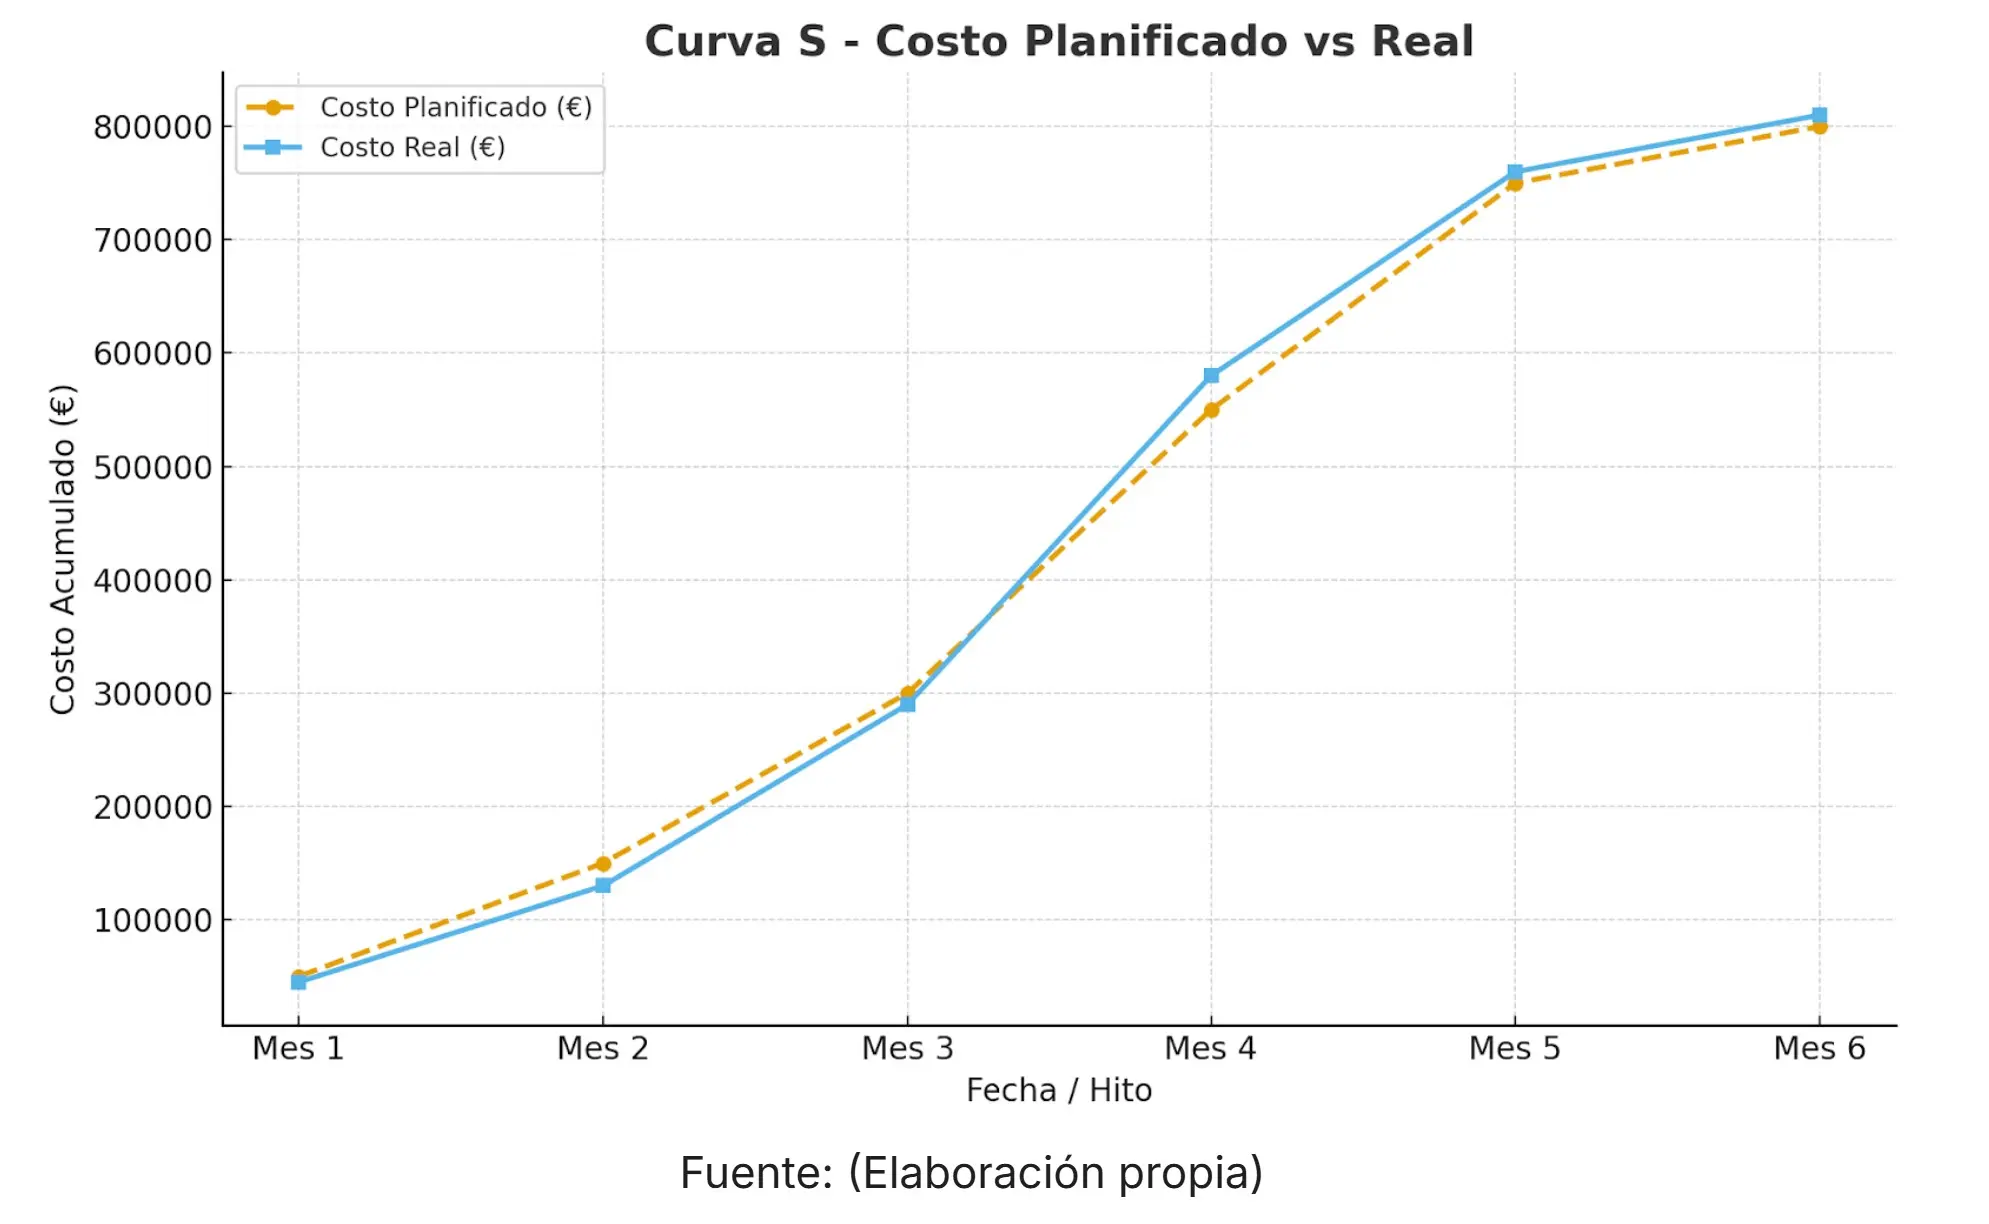
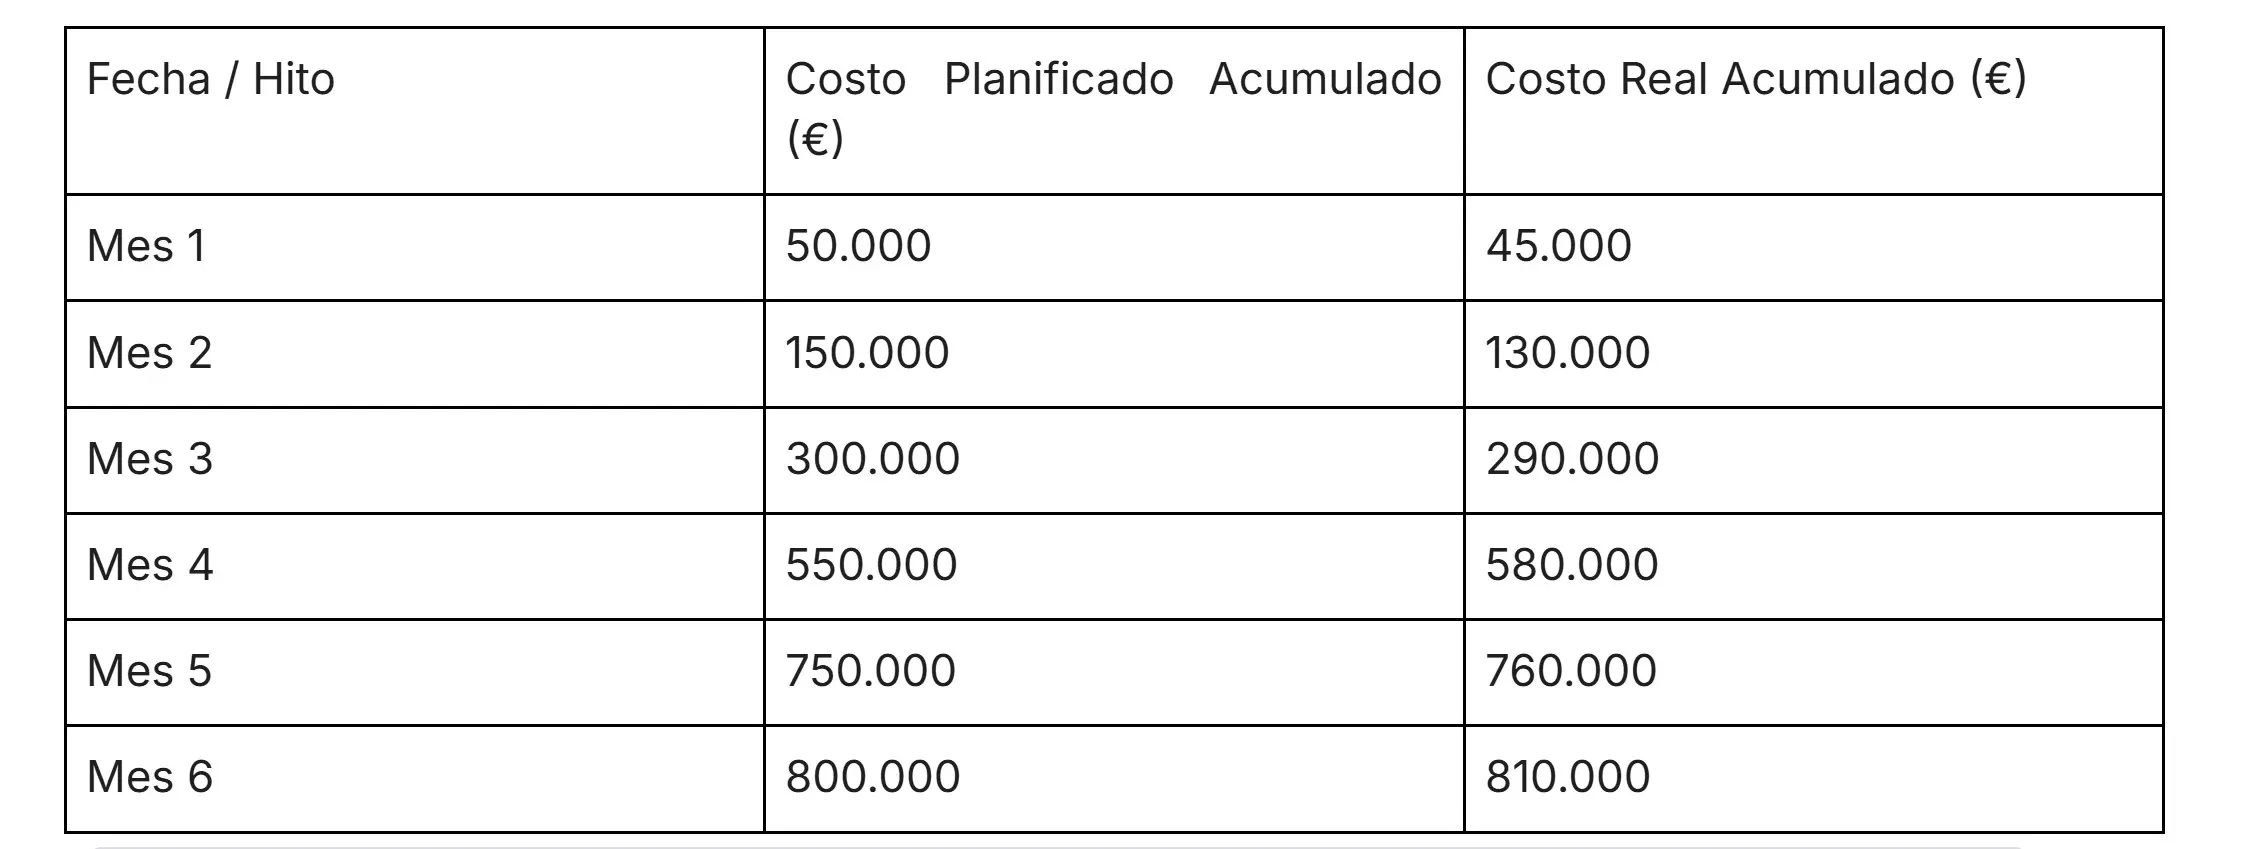
The project's S-Curve shows the evolution of cumulative cost over six months, comparing what was planned with what was actually executed. In the first three months, actual costs remain below budget, indicating slower progress or lower-than-expected expenditure. However, from month four onward, actual cost exceeds the planned figure, reflecting an acceleration in execution pace or potential cost overruns. Toward project closeout, the curves remain very close together, with a slight excess in the final actual cost (€810,000 versus the planned €800,000), evidencing relatively controlled management despite small deviations from the original plan.
Recommended tools:
Project management software: Tools such as Microsoft Project, Primavera P6, or Asana typically integrate functionality to generate S-Curves automatically.
- Spreadsheets: Programs like Microsoft Excel or Google Sheets are excellent for creating custom S-Curves from tabulated data.
Tips for effective interpretation and use:
- Always compare the actual curve with the planned curve to identify variances.
- Analyze the magnitude and trend of deviations. Are they getting worse or improving?
- Use the S-Curve alongside other key performance indicators (KPIs) for a more holistic view.
- Do not simply observe — act on the information the curve provides.
Best practices for optimizing the use of the S-Curve in construction projects
To maximize the potential of the S-Curve, consider the following best practices:
- Regular updates and comparative analysis: It is crucial to update S-Curve data consistently and periodically (weekly or biweekly). Continuous comparison against the baseline enables a timely response to any deviation.
- Integration with Earned Value Management (EVM) methodologies: Combining the S-Curve with EVM (Earned Value, Actual Cost, and Budgeted Cost of Work Planned) provides a much deeper view of project performance in terms of cost and schedule.
- Proactive use for risk anticipation: The S-Curve not only shows what has happened — it can also project the future. If the actual curve diverges significantly from the planned one, it is an early warning signal to identify potential risks and apply corrective actions before they become major problems.
- Success cases and key lessons: Learning from previous projects that used the S-Curve can provide valuable insights. Successful projects often show close alignment between planned and actual curves, while those that faced problems can reveal where efforts were underestimated or resources overestimated.
The S-Curve is a tool with both advantages and limitations. Although its use in contract administration for construction-phase control has been questioned by recent research, it remains useful and the accepted method for pre-construction financial planning and forecasting. When the design is complete, progress estimation should be based on a detailed project schedule. However, an empirical S-Curve model developed from real data offers the advantage of producing realistic estimates from few project parameters (Chao and Chien, 2009).
Conclusion
The S-Curve is much more than a simple chart; it is an essential compass in construction project management. Its ability to visualize progress cumulatively and compare it against the original plan makes it an invaluable tool for identifying deviations, communicating project status, and making proactive decisions. Incorporating it into management processes not only improves visibility and control — it also significantly increases the likelihood of delivering successful projects on time and within budget.
Want to discover more tools and methodologies to optimize the management of your construction projects? Explore Trowel's resources and content to stay up to date and maximize the success of your projects.
Simplify your project management.
WorkersForemenSite ManagersProject ManagersExternal